Metrics that Matter for Social Programs
July 20, 2022 (revised November 8, 2023) | By David M. Wagner | Download this article as a PDF
Measurement serves many purposes in a social services context. Effective metrics support program evaluation, progress monitoring, highlighting impact for funders, planning and forecasting, and more. But developing insightful metrics takes more than having a lot of data and some splashy graphics. This white paper suggests a systematic approach and framework for developing meaningful metrics for social programs.
Three Types of Social Value Metrics
The first question any measurement effort must answer is, “What are we measuring?” The bottom line is relatively straightforward for profit-driven enterprises to identify and measure. Mission-driven organizations must instead consider the social value generated by their programs and supporting indicators of success and progress. It helps to root metrics in a theory of change or a mission-driven value chain like this:
Activities
generate
Outputs
that have
Impact
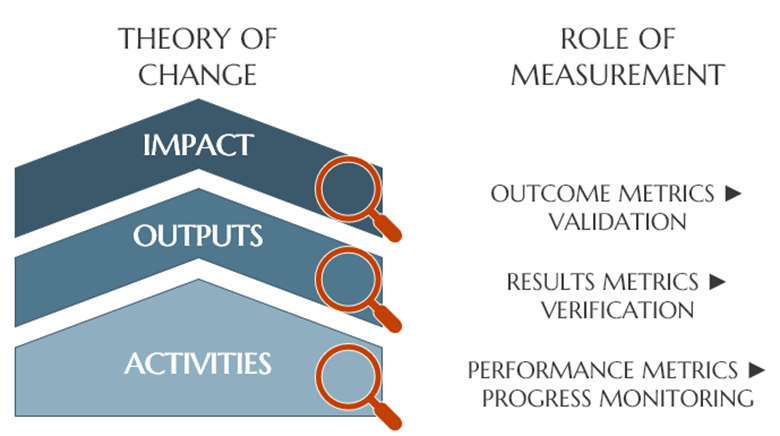
It is usually possible to measure each “tier” of this simplified model of social change. Each tier is supported by a different type of metric, as depicted below:
1. Performance metrics that monitor the execution of program activities,
2. Results metrics that verify programs are producing expected results, and
3. Outcome metrics to measure impact (or social value) and validate the theory of change.
Role of measurement at each tier in a simplified Theory of Change model
Why describe these as different types of metrics, rather than just three different aspects of program assessment?
They answer different questions. Each type of metric measures something different and enables different types of decisions. A performance metric might address, “Will our program execute on schedule?” Results tell us, “Is our program producing the expected results?” Whereas an outcome indicates both, “Are we having an impact?” and, “Did we have the right plan to benefit our community?”
The audiences differ. Staff may be most interested in detailed data about activities, while outputs matter more to organization leaders, and funders may care the most about impact.
The timescales differ. Programs’ progress against planned activities may occur on a monthly, weekly, or even daily time frame, depending on the scope. By contrast, outputs may be difficult to measure until a program’s conclusion. And impact may not be realized for years.
The availability of data will differ. Organizations that deliver programs will possess the data about their activities. Outputs can be more challenging to measure and often require cooperation of program participants (e.g., through surveys). Impact is often measured at a community level and so may depend on the (long-term) cooperation of participants or access to data from third parties, such as government agencies.
This framework is not intended to suggest that there are only three types of metrics for social programs, or that there are no metrics that bridge tiers. Rather, the framework points to intended usage and other design factors that can help make metrics easier to select, build, and manage.
Metrics Design Choices and Factors
Ideally, staff charged with measuring program activities, outputs, and impact will have the opportunity to design metrics (and identify data collection requirements) before a program begins. These factors can still guide metrics development even if you are building measurement “on the fly” or post facto for an existing (or past) program.
What question(s) or decisions will your metrics address? This is arguably the most important design factor. Meaningful metrics answer the questions that matter most for decision-makers. Sometimes these are labeled Key Performance Indicators (KPIs).
Who is the audience? Consider whether your metrics will be used by executive leadership, your board, funders, program teams, participants, or even the general public. Not every metric is appropriate or useful for every stakeholder type.
What’s the timescale? Will the metric track data that changes every day, every week, monthly, annually, or some other frequency? The shorter the time frame, the more important it will be that the metric can be updated automatically.
What data is (most likely to be) available? We don’t always get to choose that data we work with. The best metric is one that is unambiguous, directly measures a factor of interest, and leverages data that is consistent (in format and completeness). But any metric that measures a relevant indicator, so long as it is accompanied by an explanation of its interpretation and limitations, is often better than none.
The Framework in Practice
The example below is inspired by a project Clear Mission Consulting performed for a client. The objective was to design dashboards for a suite of programs intended to increase the local pipeline of workers in the healthcare field. Here is how the metrics framework could apply to one of their programs to engage local schools to increase student awareness and interest in healthcare careers.
Example of the metrics framework applied to a healthcare workforce development program
A key performance metric of the program’s activities was the number of student engagement hours completed, computed by multiplying the duration of an engagement by the number of student participants. The immediate output of these engagements could be measured through pre- and post-engagement surveys, for example, as a results metric. Finally, as the ultimate aim of the program was increase the size of the local healthcare workforce, an outcome metric might be the local healthcare employment rate (e.g., healthcare workers per 100,000 residents).
Building metrics that matter is a creative endeavor; it can require as much art as science. But by following a systematic approach, such as by following the framework in this paper, you can generate meaningful measurements for any social program.
For help getting started on your measurement program, or transforming your measurements into a more powerful tool for strategic decision making, schedule a free consult today.


